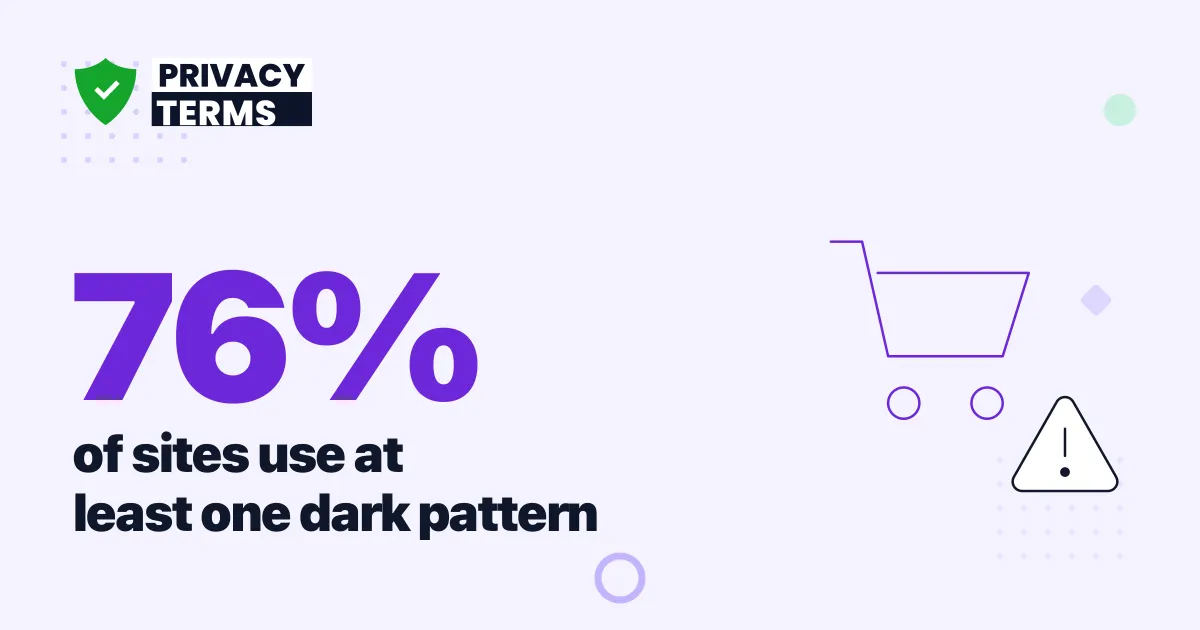
About 76% of the websites and apps examined in a January 2024 sweep by 27 consumer protection authorities in the International Consumer Protection and Enforcement Network (ICPEN) used at least one dark pattern, and two-thirds used more than one. That headline figure is nearly seven times higher than the 11.1% found in the largest independent academic web crawl, and the entire gap comes down to how each study defines and counts a dark pattern.
Neither number is wrong. They are answering different, precisely scoped questions, and the honest answer to "what percentage of websites use dark patterns" depends on which question you are actually asking. Below is what the largest studies actually measured, how their methods differ, and which specific pattern types show up most often once you look inside the aggregate numbers.
What percentage of websites use dark patterns?
The most recent and broadest cross-border count is ICPEN's 2024 global sweep: 27 consumer protection authorities from 26 countries examined the websites and apps of 642 traders between January 29 and February 2, 2024, and found that 75.7% used at least one dark pattern, with 66.8% using two or more. The most frequent tactics were sneaking, specifically the inability to turn off subscription auto-renewal, and interface interference that made the trader's preferred, more expensive option visually more prominent than the alternative.
Figure 1: The same underlying phenomenon, three very different percentages, because each study used a different sample, definition, and detection method. Sources: ICPEN Public Report (July 2024); European Commission CPC Network sweep results (January 2023); Mathur et al., Dark Patterns at Scale, CSCW 2019.
An earlier, narrower EU sweep from 2022 found dark patterns on 37.1% of 399 online shops, and the largest independent academic crawl, published by Princeton and University of Chicago researchers in 2019, found them on just 11.1% of 11,286 shopping sites. All three numbers are defensible; none of them is "the" answer on its own. If you sell subscriptions or recurring services, the practical takeaway from every one of these studies is the same regardless of which percentage you trust: cancellation flows and auto-renewal disclosures are the specific area regulators check first, and a terms and conditions agreement that states cancellation and renewal terms clearly is the baseline documentation every one of these sweeps expects a compliant site to have.
Why do dark pattern prevalence estimates range from 11% to 76%?
The gap between 11.1% and 75.7% is not a data quality problem. It is a direct result of three different research designs answering three different questions about scope, and understanding which question each study asked is the only way to compare them fairly.
The 2019 Princeton and University of Chicago study used an automated web crawler that only read text on product, cart, and checkout pages across 11,286 shopping sites, and classified a site as having a dark pattern only if its detection pipeline flagged specific pre-defined text patterns. The researchers themselves describe this as a lower-bound estimate, since it could not detect anything conveyed through color, layout, or images rather than text. The EU's 2022 sweep replaced automation with human reviewers, but restricted them to checking for exactly three categories: fake countdown timers, misleading visual hierarchy, and hidden information, across 399 sites. ICPEN's 2024 sweep kept human reviewers but broadened the checklist to six OECD-aligned indicators covering the full site and app experience, not just checkout text, which is the single biggest reason its percentage is the highest of the three.
Figure 2: Broader scope and human review, not more dark patterns appearing over time, explains most of the gap between the lowest and highest published estimates. Source: methodology sections of each cited study.
Every credible study agrees on the direction, even where the exact figure differs: dark patterns are common on shopping and subscription sites specifically, not evenly distributed across the general web, and the tactics regulators find most often cluster around subscription cancellation and checkout urgency.
Which specific dark pattern type is most common on websites?
Aggregate percentages hide which individual tactic actually shows up most. In the 2019 Princeton and University of Chicago crawl, the single most common dark pattern type by number of sites was the low-stock scarcity message ("Only 3 left in stock!"), found on 581 of the 11,286 shopping sites crawled, or 5.1% of the entire data set. Countdown timers were the second most common at 3.2% of sites (361 sites), followed by activity notifications, messages showing other users' recent purchases or views, at 2.3% (264 sites).
Figure 3: Share of the full 11,286-site data set that used each dark pattern type, ranked by prevalence. Source: Mathur et al., Dark Patterns at Scale, CSCW 2019, Table 1.
Confirmshaming, the pattern that uses guilt or embarrassment to steer a user away from declining an offer (a "No thanks, I don't want to save money" style opt-out link), appeared on 164 sites, or 1.5% of the full data set, making it the most common misdirection-category pattern the researchers found. Sneaking-category patterns, like adding items to a cart without consent or hiding a subscription inside what looks like a one-time purchase, were the rarest, each appearing on fewer than 15 sites out of 11,286.
Does the EU sweep tell a different story about which type is most common?
The EU's 2022 sweep, which checked human-reviewed retail sites rather than running an automated crawl, found a different type ranking, and the difference is itself useful data: it shows detection method changes which pattern looks most common, not just how many sites get flagged overall.
Figure 4: Share of the 189 total dark pattern instances flagged across the EU's 2022 sweep of 399 online shops, by type. Source: European Commission CPC Network sweep results, January 2023.
Hidden information, undisclosed fees or terms revealed only late in checkout, was the most common issue human reviewers found, flagged on 70 of the 399 sites (17.5% of the full sample). Visual or choice manipulation, where interface design steers a user toward a specific option, appeared on 54 sites (13.5%), fake countdown timers on 42 sites (10.5%), and hidden subscription terms specifically, arguably the most consumer-harmful category, on 23 sites (5.8%). Reviewers also checked a subset of 102 mobile apps tied to the screened retailers and found dark patterns in 27 of them, a 26.5% rate roughly in line with the website findings; a fuller breakdown of app-specific prevalence sits outside this post's scope.
Are more popular websites more likely to use dark patterns?
Yes, and the correlation is statistically strong. The 2019 Princeton and University of Chicago crawl tested whether a shopping site's Alexa traffic rank predicted how many dark patterns it used, and found a Spearman's rho of -0.62 (p < 0.0001), meaning more popular sites (a lower, better Alexa rank number) consistently had more dark pattern instances, not fewer. The researchers noted this pattern is consistent with larger, better-resourced sites running more conversion-optimization experiments and having more third-party tooling available to implement urgency and scarcity messaging at scale.
That popularity correlation matters for how you read any single-number prevalence claim. A study sampling only the most-trafficked shopping sites, as several dark patterns news cycles informally do when picking examples, will tend to find a higher rate than a study sampling the full long tail of smaller e-commerce sites, independent of any change in overall practice. The identity of who is being sampled, not just how a dark pattern is defined, moves the final percentage.
How has dark pattern measurement changed since 2018?
Figure 5: Six years of dark pattern research moved from a single-company case study to global, multi-country regulatory sweeps. Source: cited reports, 2018 to 2025.
Each new study broadened scope rather than narrowing it: from three companies in 2018, to 11,286 automatically-crawled shopping sites in 2019, to hundreds of human-reviewed traders across dozens of countries by 2024. That broadening trend, more than any single year-over-year change in actual site behavior, is why every new headline percentage tends to be higher than the last one. A separate look at how many fines and enforcement actions this scrutiny has produced sits outside the scope of this post.
How do the four largest studies compare?
| Study | Year | Sample | Method | Share with dark pattern |
|---|---|---|---|---|
| ICPEN global sweep | 2024 | 642 traders, 26 countries | Human review, 6 OECD-style indicators, full site/app | 75.7% |
| EU CPC Network sweep | 2022 | 399 online shops, 25 authorities | Human review, 3 defined pattern types | 37.1% |
| Mathur et al. crawl | 2019 | 11,286 shopping sites | Automated text detection, checkout-flow only | 11.1% |
| Norwegian Consumer Council | 2018 | 3 companies (Facebook, Google, Windows 10) | Qualitative UX review of GDPR consent flows | Not a percentage; case-study format |
The Bottom Line
There is no single correct percentage for "how many websites use dark patterns," and any post that gives you one number without naming its source and method is hiding the more useful answer. The defensible range, once you account for method, runs from an 11.1% automated-crawl lower bound to a 75.7% broad-scope regulatory upper bound, and both are true simultaneously because they measure different things. What every study agrees on is where the risk concentrates: subscription cancellation flows, checkout urgency messaging, and scarcity claims are the specific tactics that show up across every methodology, which means they are also the specific things worth auditing first. If your site sells anything on a recurring basis, pairing an accurate terms and conditions agreement with a cancellation flow that matches what it discloses addresses the exact gap every one of these sweeps checks for.
Frequently Asked Questions
What percentage of websites use dark patterns? About 75.7% of the 642 traders' websites and apps examined in the International Consumer Protection and Enforcement Network's 2024 global sweep used at least one dark pattern, and 66.8% used two or more. An independent 2019 academic crawl of 11,286 shopping sites, using a narrower, automated detection method, found dark patterns on only 11.1% of sites, showing how much the definition and detection method change the answer.
Why do different studies report such different dark pattern percentages? The gap comes down to scope and method. The 2019 Princeton and University of Chicago crawl only scanned product, cart, and checkout page text with automated tools, catching a lower bound of 11.1% of 11,286 sites. The EU's 2022 sweep had human reviewers check for 3 defined pattern types across 399 shops and found 37.1%. ICPEN's 2024 sweep had human reviewers apply 6 broader OECD-style indicators across the full site and app experience for 642 traders and found 75.7%.
Which specific dark pattern type is most common on websites? Low-stock scarcity messages ("Only 3 left in stock") are the single most common type, appearing on 5.1% of the 11,286 shopping sites in the 2019 Princeton and University of Chicago crawl (581 sites), ahead of countdown timers at 3.2% (361 sites) and activity notifications at 2.3% (264 sites).
Are more popular websites more likely to use dark patterns? Yes. The same 2019 crawl found a statistically significant negative correlation (Spearman's rho of -0.62, p < 0.0001) between a shopping site's Alexa popularity rank and its dark pattern count, meaning the most-visited shopping sites used dark patterns more often than less-visited ones.
Where the Numbers Come From
- International Consumer Protection and Enforcement Network. (2024). "Public Report: ICPEN Dark Patterns Sweep." 642 traders examined 29 January to 2 February 2024 by 27 authorities from 26 countries; 75.7% had at least one dark pattern, 66.8% had two or more. Published 9 July 2024.
- Mathur, A., Acar, G., Friedman, M. J., Lucherini, E., Mayer, J., Chetty, M., and Narayanan, A. (2019). "Dark Patterns at Scale: Findings from a Crawl of 11K Shopping Websites." Proc. ACM Hum.-Comput. Interact. 3, CSCW, Article 81. 1,254 of 11,286 shopping sites (11.1%) had at least one of 1,818 discovered dark pattern instances across 15 types.
- European Commission. Consumer Protection Cooperation Network sweep results, dark patterns sweep of 399 online shops across 23 member states, Norway, and Iceland; 148 sites (37.1%) had at least one of three tracked dark pattern types. Results published January 2023.
- Norwegian Consumer Council (Forbrukerradet). (2018). "Deceived by Design: How Tech Companies Use Dark Patterns to Discourage Us from Exercising Our Rights to Privacy." Case-study review of Facebook, Google, and Windows 10 GDPR consent interfaces, published 27 June 2018.
- Federal Trade Commission. (2022). "Bringing Dark Patterns to Light: Staff Report." Enforcement-focused review of dark pattern practices across e-commerce, subscriptions, and children's apps, published 14 September 2022.
Note: All figures verified as of September 2026. The 2019 Mathur et al. figures reflect the study's own stated lower-bound methodology (text-only, checkout-flow detection); broader-scope sweeps published since then report higher percentages by design, not because the underlying practice necessarily grew at the same rate.