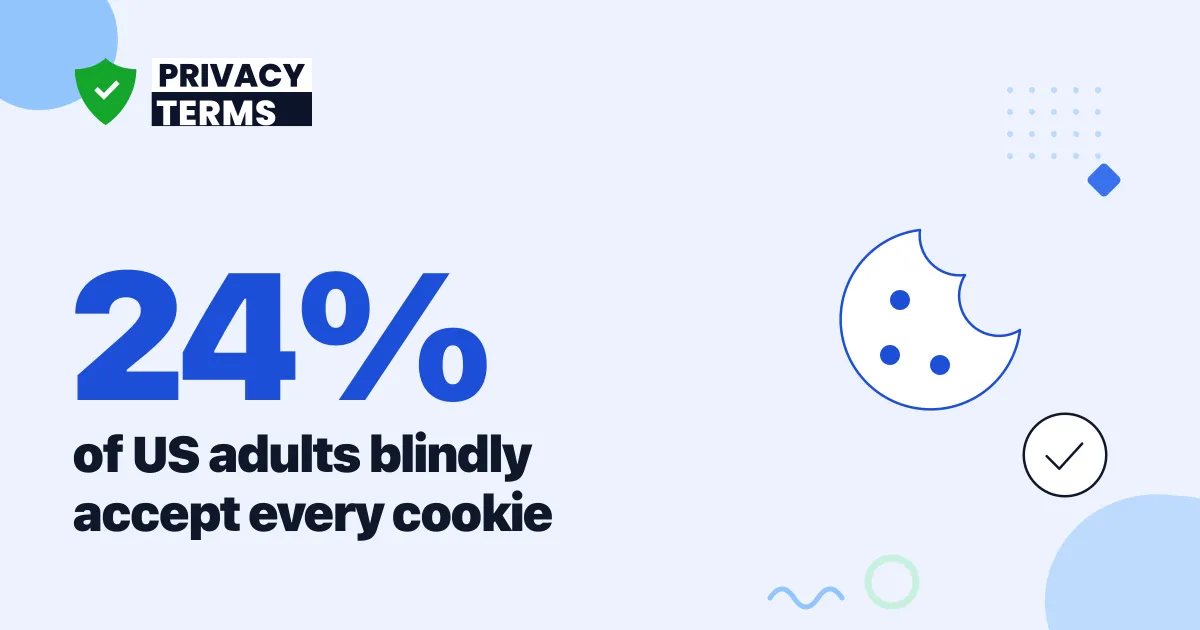
24% of US adults say they blindly accept all cookies whenever a consent banner appears, according to an August 2025 Pollfish survey of 1,000 US adults conducted for All About Cookies. That self-reported figure is only part of the story: real click-through data from millions of actual banner interactions shows the true accept-all rate ranges from under 1% to 98.8%, and the single biggest factor is not user intent but whether the cookie boxes start checked or unchecked.
What percentage of users click Accept All on a typical banner?
On a banner that offers a plain Accept button and an equally prominent Decline button, a field experiment on a real German e-commerce site found that 41.0% of mobile visitors and 20.9% of desktop visitors clicked Accept, according to Utz, Degeling, Fahl, Schaub, and Holz's field study published at ACM CCS 2019. The experiment tracked 36,395 real visitors across nine banner variants between December 2018 and January 2019, and mobile users consistently accepted at roughly double the desktop rate.
Figure 1: Click-through accept rate on a two-button Accept/Decline banner, by device and whether the Accept button was visually highlighted. Source: Utz et al., ACM CCS 2019, 36,395 visitors.
That 41% mobile figure sits close to the 59% acceptance rate CNIL measured across 1,000 French websites through June 2022, covered in more depth in our Cookie Consent Statistics 2026 report. Both numbers describe a genuine binary choice, equal-prominence buttons and a real Decline option, and both land well below the figures banner vendors sometimes advertise for "typical" accept rates, which usually come from banners that are not built this fairly.
Does pre-checking the boxes change how many people accept all cookies?
Enormously. When a category-based banner leaves every checkbox unchecked by default, requiring an active choice to allow anything, Cookiebot's real-world dataset of more than 3.1 million consent decisions across 2,000 websites found an accept-all rate of just 5.59% as of February 2019. When the same style of banner starts with every box pre-checked, so a visitor has to actively uncheck boxes to decline, the accept-all rate jumps to 98.84%, per the same Cookiebot data reported in Utz et al.'s CCS 2019 study.
The researchers' own smaller-scale field data confirmed the same pattern in miniature: 0.16% accepted all categories when nothing was pre-selected, versus 83.55% when everything was. The gap is not about how people feel about cookies. It is almost entirely about which action requires effort, clicking to add consent, or clicking to remove it.
How much does nudging move the accept-all rate?
Beyond pre-checking, banner designers use a second lever: visually highlighting the Accept option over Decline or Reject. In the same field study, highlighting the confirmation button lifted the accept rate from 39.2% to 50.8% among mobile visitors, and from 21.1% to 26.9% among desktop visitors. Category-based banners showed the largest swing of all once both pre-selection and highlighting were combined.
Figure 2: Outcome breakdown for a nudged, pre-checked category banner on mobile. Source: Utz et al., ACM CCS 2019, Experiment 2, n=36,395.
Even with every category pre-checked and the submit button highlighted, only 33.1% of mobile visitors actively submitted the accept-all state, compared to 98.84% in Cookiebot's aggregate dataset. The difference between the two figures is the underlying banner mechanism itself: Cookiebot's number includes simple one-click confirmation banners, while this experiment used a category-by-category checkbox layout, which takes more visible effort to confirm even when nothing has to be unchecked.
What share of cookie banners actually give visitors a real choice?
Not many, at least as of the last large-scale audit. A random sample of 1,000 cookie notices, drawn from 5,087 collected across the most popular websites in every EU member state in August 2018, found that 68.0% offered only a single confirmation button with no decline option, while 27.8% offered no interactive option at all, just a statement that continuing to browse implied consent.
Figure 3: How 1,000 sampled EU cookie banners structured visitor choice. Source: Utz et al., ACM CCS 2019, sample drawn from Degeling et al.'s NDSS 2019 dataset.
Only 3.2% of the sampled banners offered an equal binary choice, and just 1.0% offered category-level checkboxes. That distribution matters for reading any accept-all statistic: if 68% of banners in the wild only offer a single confirmation button, most reported accept-all rates are measuring how often visitors dismiss a notice that never gave them a real alternative, not how often visitors weigh cookies and choose yes.
Why does the reported accept-all percentage vary so much across studies?
Because "accept all" describes at least four different user actions depending on the banner, and each produces a different number. A yes/no click on an equal binary banner behaves nothing like confirming a pre-checked category list, and neither behaves like a self-reported survey answer.
Figure 4: Why the same question, what percentage accept all cookies, produces wildly different answers depending on banner mechanism. Source: synthesized from Utz et al., ACM CCS 2019 and Cookiebot's external validation dataset.
Any accept-all statistic quoted without naming which of these five mechanisms it measured should be treated as incomplete. The single most reliable predictor across every dataset here is not region, device, or even the visible wording of the banner. It is whether the default state, before the visitor touches anything, is set to accept or to decline.
How has cookie consent enforcement evolved since 2018?
Regulators have spent the years since GDPR took effect trying to close the pre-checked-box loophole that produces such high accept-all numbers. Guidance from EU data protection authorities has repeatedly stated that pre-ticked boxes do not constitute valid consent, and enforcement against banners that still use them has accelerated.
Figure 5: Milestones in cookie consent measurement and enforcement, 2018 to 2025. Source: Degeling et al. (NDSS 2019), Utz et al. (CCS 2019), CNIL (2022, 2025), All About Cookies (2025).
If your site still uses a pre-checked category banner or a confirmation-only notice with no decline option, both patterns this data ties to inflated accept-all numbers, that gap is exactly the kind of consent mechanism regulators are now fining companies over. Pairing a compliant banner with a privacy policy that accurately discloses what each cookie category does is the more defensible path, and you can generate a privacy policy that lists cookie categories and legal bases consistently with how your consent banner is actually configured.
Accept-all rate by banner mechanism
| Banner mechanism | Accept-all rate | Sample | Source |
|---|---|---|---|
| Equal Accept/Decline buttons, mobile | 41.0% | 36,395 visitors | Utz et al., CCS 2019 |
| Equal Accept/Decline buttons, desktop | 20.9% | 36,395 visitors | Utz et al., CCS 2019 |
| Category checkboxes, none pre-checked | 5.59% | 1.13M decisions | Cookiebot, via Utz et al., CCS 2019 |
| Category checkboxes, all pre-checked | 98.84% | 1.99M decisions | Cookiebot, via Utz et al., CCS 2019 |
| Self-reported, US adults, 2025 | 24% | 1,000 US adults | All About Cookies / Pollfish, 2025 |
The Bottom Line
There is no single honest answer to "what percentage of users accept all cookies" without specifying which banner mechanism produced the number. Asked directly, only 24% of US adults admit to blindly accepting everything. Watched in the field on a fair, equal-prominence banner, roughly 21% to 46% of visitors click Accept depending on device and nudging. Watched on a pre-checked category banner, the figure can reach 98.8%, not because visitors chose it, but because they never touched the boxes at all. For any site owner deciding how to configure a consent banner, the practical lesson is that regulators increasingly treat the pre-checked version as invalid consent regardless of the resulting number, so the accept-all rate a compliant banner produces should be the lower, honestly-earned figure, not the inflated one.
Frequently Asked Questions
What percentage of users accept all cookies? 24% of US adults say they blindly accept all cookies when a banner appears, according to an August 2025 Pollfish survey of 1,000 US adults for All About Cookies. The real click-through rate varies far more widely in practice, from under 1% up to 98.8%, depending on whether cookie categories start checked or unchecked.
Does pre-checking cookie categories increase the accept-all rate? Yes, dramatically. Cookiebot's dataset of more than 3.1 million consent decisions across 2,000 websites, reported in Utz et al.'s ACM CCS 2019 field study, found a 5.59% accept-all rate when no category was pre-selected versus a 98.84% accept-all rate when every category was pre-checked by default.
Do more people accept cookies on mobile or desktop? Mobile. In a controlled field experiment on a real e-commerce site with 36,395 visitors, 41.0% of mobile visitors clicked Accept on an equal-prominence Accept and Decline banner, compared to 20.9% of desktop visitors, per Utz et al., ACM CCS 2019.
What share of cookie banners actually let visitors say no? Very few, historically. A random sample of 1,000 cookie notices collected from popular EU websites in August 2018 found that 68.0% offered only a single confirmation button with no way to decline, and 27.8% offered no interactive option at all, per Utz et al., ACM CCS 2019.
Where the Numbers Come From
- All About Cookies. (2025). "Cookies Survey." Pollfish survey of 1,000 US adults, conducted August 2025; 24% blindly accept all, 25% reject all, 27% customize.
- Utz, Degeling, Fahl, Schaub, and Holz. (2019). "(Un)informed Consent: Studying GDPR Consent Notices in the Field." ACM SIGSAC Conference on Computer and Communications Security (CCS 2019). Field study of 82,890 unique visitors across three experiments, including a 36,395-visitor experiment on choices and nudging, plus an external validation dataset from Cookiebot covering more than 3.1 million consent decisions on 2,000 websites (February 2019).
- Degeling, Utz, Lentzsch, Hosseini, Schaub, and Holz. (2019). "We Value Your Privacy... Now Take Some Cookies: Measuring the GDPR's Impact on Web Privacy." Network and Distributed System Security Symposium (NDSS 2019). Audit of 6,579 popular EU websites; cookie notice prevalence rose from 46.1% to 62.1% after GDPR, 80% offered no opt-out.
- CNIL. (2022). "Evolution of Practices on the Web Regarding Cookies." 1,000 top French websites monitored January 2021 to August 2022; 59% acceptance, 39% refusal as of June 2022.
- CNIL. (2025). "Cookies Placed Without Consent: SHEIN Fined 150 Million Euros by the CNIL." 1 September 2025 decision, part of 83 sanctions issued across 2025 including a 325 million euro fine against Google the same day.
Note: All figures verified as of August 2026. The Utz et al. and Degeling et al. field data date to 2018 and 2019 and are the most recent large-scale click-through studies of their kind publicly available; the Cookiebot and CNIL figures anchor the pattern with more recent aggregate and self-reported data. This post will be refreshed if a newer large-scale field study of accept-all click rates is published.