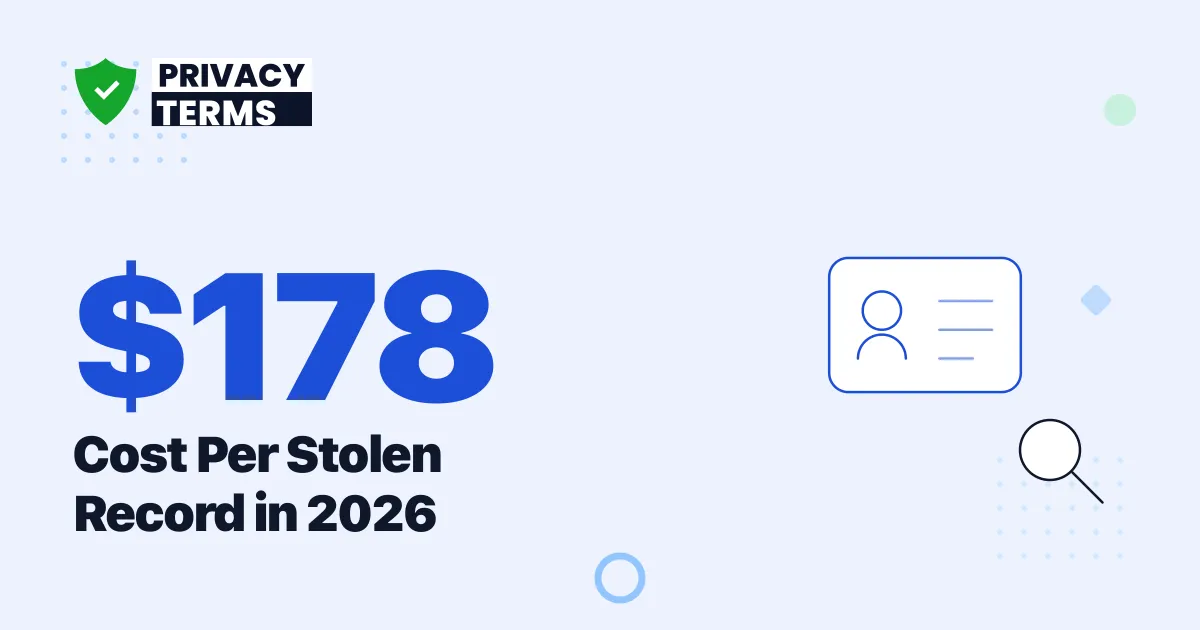
A stolen intellectual property record cost an average of USD 178 in 2025, the most expensive of five data types IBM and the Ponemon Institute track in the Cost of a Data Breach Report 2025. Customer personal data, the type stolen most often at 53% of breaches, cost USD 160 per record, while anonymized customer data was cheapest at USD 115. Every category fell year over year except intellectual property, which rose USD 5.
What does a stolen record cost in 2026?
The most current published figures, from IBM's Cost of a Data Breach Report 2025, put per-record cost somewhere between USD 115 and USD 178, depending on what type of data was taken. There is no single blended number; IBM tracks five distinct categories of stolen or compromised data and prices each one separately, because the downstream cost of a leaked trade secret and a leaked email address are not remotely comparable.
The research behind these figures is not a survey of headlines. The Ponemon Institute interviewed 3,470 security and business leaders at 600 organizations that had experienced a confirmed breach, spanning 17 industries and 16 countries or regions, for breaches ranging from 2,960 to 113,620 compromised records. Ponemon has run this benchmark continuously since 2005, studying 6,485 breaches and interviewing more than 34,652 practitioners across two decades, which is what makes the per-record figures usable as a planning input rather than a one-off estimate.
Takeaway: per-record cost is not one number; it is a range from USD 115 to USD 178 that depends entirely on what kind of data walked out the door.
Which type of stolen data costs the most?
Intellectual property, at USD 178 per record, even though it is the least commonly stolen of the five categories IBM tracks, present in only 33% of breaches. Customer personal data is the opposite case: the most frequently stolen type, at 53% of breaches, but the third most expensive per record at USD 160.
The full breakdown shows a pattern worth noting on its own: four of the five categories got cheaper per record between 2024 and 2025, and one got more expensive.
Figure 1: Per-record cost by data type, 2025. Source: IBM Cost of a Data Breach Report 2025.
| Data type | Share of breaches (2025) | Cost per record (2025) | Cost per record (2024) |
|---|---|---|---|
| Intellectual property | 33% | USD 178 | USD 173 |
| Employee personal data | 37% | USD 168 | USD 189 |
| Customer personal data | 53% | USD 160 | USD 179 |
| Other corporate data | 34% | USD 154 | USD 171 |
| Anonymized customer data | 28% | USD 115 | USD 132 |
Employee personal data fell the furthest in percentage terms, down 11% to USD 168, and anonymized customer data fell the furthest in absolute terms among the lower-cost categories, down USD 17 to USD 115. Intellectual property is the outlier: it rose USD 5 even as every other category declined, which IBM attributes in part to the long, expensive investigations that trade-secret theft tends to trigger compared with a routine consumer-data leak.
Takeaway: the record type that got stolen most often, customer personal data, was not the most expensive one; the least commonly stolen type, intellectual property, was.
How does AI change the cost of a stolen record?
Shadow AI, meaning AI tools employees adopt without security team approval, changes the economics of a stolen record in a specific and measurable way. Customer personal data stolen in a breach that involved shadow AI cost USD 166 per record, six dollars above the USD 160 global average for that category, and shadow AI incidents overall added USD 200,000 to the average total breach cost.
The pattern is not uniform across data types. Customer PII was the only category that cost more per record in a shadow AI incident than the global average; every other category IBM tracks cost less per record when shadow AI was involved, likely because shadow AI incidents skew toward less severe categories of exposure even as they take longer to catch.
| Data type | Global average per record | In shadow AI incidents |
|---|---|---|
| Customer personal data | USD 160 | USD 166 |
| Employee personal data | USD 168 | USD 161 |
| Intellectual property | USD 178 | USD 152 |
| Other corporate data | USD 154 | USD 145 |
| Anonymized customer data | USD 115 | USD 108 |
Detection speed helps explain the added cost. Organizations' own security teams and tools identified 57% of shadow AI security incidents, ahead of the 50% rate for breaches overall, while attackers disclosed the breach first in only 12% of shadow AI cases versus 19% of breaches generally.
Figure 2: How organizations first learned about a shadow AI security incident. Source: IBM Cost of a Data Breach Report 2025.
Takeaway: shadow AI raises the cost of the record type attackers want most, customer PII, while shaving cost off the other four categories, a swap that still nets out to a USD 200,000 premium on the total bill.
Why doesn't per-record cost scale to mega-breaches?
Multiplying USD 160 by a mega-breach's record count is the most common misuse of this statistic, and IBM addresses it directly in its own methodology notes: the per-record figures are not a valid basis for estimating the cost of a breach involving millions of records.
The reason is sampling. IBM's per-record cost is derived from studying hundreds of individual breach events, and every one of those events involved somewhere between 2,960 and 113,620 compromised records, roughly the size of a mid-sized company's customer database, not a nation-scale leak. A breach ten or a hundred times larger does not carry proportionally ten or a hundred times the notification, legal, and remediation cost; large parts of the response, forensics, executive time, and regulatory engagement, are closer to fixed costs that do not scale linearly with record count.
Figure 3: When the per-record model applies, and when it does not. Source: IBM Cost of a Data Breach Report 2025 methodology notes.
For a breach at the scale of the largest incidents on record, the country and industry averages covered in our companion piece on the cost of a data breach are the more accurate comparison than any per-record math.
Takeaway: per-record cost is a useful unit price for a typical breach under roughly 114,000 records; past that scale, it stops being arithmetic and the whole-incident averages take over.
How does per-record cost compare to per-incident cost?
IBM's per-record figures describe unit cost. A separate, independently gathered dataset describes the whole picture from a different angle: what a typical breach costs an organization overall, regardless of how many records were involved.
Verizon and CyberAcuView's 2026 Breach Impact Study, published in 2026 and built from roughly 70,000 US cyber insurance claims (about 38,000 with recorded, paid-out losses) filed between January 2019 and October 2025, found the median financial impact of a breach climbed from about USD 60,000 in 2019 to about USD 110,000 in 2024, an 80% increase that outpaced the roughly 23% rise in US consumer prices over the same period. Half of all paid claims in the full dataset exceeded USD 83,000, the top 10% exceeded USD 920,000, and the most extreme 2.5% of cases exceeded USD 5 million.
| Percentile | Financial impact of the claim |
|---|---|
| Median (50th) | more than USD 83,000 |
| Top 10% (90th) | more than USD 920,000 |
| Top 2.5% (97.5th) | more than USD 5,000,000 |
Cost also scales sharply with organization size. Segmenting claims by revenue band, the median financial impact was about USD 38,000 for small and mid-sized businesses under USD 25 million in revenue, about USD 96,000 for mid-market businesses, and about USD 283,000 for large enterprises above USD 250 million in revenue, whose top 2.5% of claims exceeded USD 22 million.
Figure 4: Median financial impact per claim by revenue band. Source: Verizon and CyberAcuView 2026 Breach Impact Study.
The two datasets measure different things using different methods, insurance claims payouts versus benchmarked organizational interviews, so they should not be averaged together. What they agree on is the shape of the story: breach cost is rising, it varies enormously by what was taken and who was hit, and no single average captures either the record-level or the incident-level reality on its own. For broader context on how these figures fit the wider breach landscape, our data breach roundup covers frequency and causes alongside the cost figures here.
Figure 5: Timeline of the two data collection windows behind this post's figures. Source: IBM Cost of a Data Breach Report 2025; Verizon and CyberAcuView 2026 Breach Impact Study.
Takeaway: per-record cost and per-incident cost are two different, independently sourced measurements of the same underlying problem, and both point the same direction: breach economics keep getting worse.
The Bottom Line
There is no single "cost per stolen record" for 2026; there is a range from USD 115 to USD 178 that depends on what type of data was taken, and it should never be multiplied straight through against a mega-breach's record count. Intellectual property is the most expensive record by a wide margin despite being the least commonly stolen, customer personal data is the most frequently stolen despite sitting in the middle of the cost range, and shadow AI quietly raises the price of the record attackers want most while lowering it for everything else. A separate, independently gathered insurance-claims dataset confirms the direction even though it measures a different unit: whole-incident costs nearly doubled in five years. The practical read for any organization handling personal data is that the record types costing the most, customer and employee personal information, are exactly what a privacy policy generator helps you document honestly: what you collect, why, and how long you keep it, which shrinks the pool of records an attacker can steal in the first place.
Frequently Asked Questions
What is the average cost per stolen record in 2026? The most recent published figures come from IBM's Cost of a Data Breach Report 2025, based on 600 breached organizations studied by the Ponemon Institute. Per-record cost depends on data type: intellectual property averaged USD 178, employee personal data USD 168, customer personal data USD 160, other corporate data USD 154, and anonymized customer data USD 115.
Which type of stolen data is the most expensive per record? Intellectual property, at USD 178 per record in 2025, even though it was stolen or compromised in only 33% of breaches, the least common of the five data types IBM tracks. It was also the only category whose per-record cost rose year over year, up from USD 173 in 2024.
Does the cost per record change when AI systems are involved? Yes. In breaches involving unmanaged shadow AI tools, customer personal data cost USD 166 per record, above the USD 160 global average, and shadow AI incidents added USD 200,000 to the average total breach cost, per IBM's 2025 report.
Can I multiply the cost per record by the number of records in a mega-breach? No. IBM states directly that its per-record figures are derived from breaches capped at 113,620 compromised records and are not a valid basis for estimating the cost of incidents involving millions of records. For breaches at that scale, whole-incident benchmarks are the more accurate comparison.
Where the Numbers Come From
- IBM. (2025). "Cost of a Data Breach Report 2025." Research conducted by the Ponemon Institute across 600 organizations, 17 industries, and 16 countries or regions, study window March 2024 to February 2025, published August 2025. Source for per-record cost by data type: intellectual property USD 178, employee personal data USD 168, customer personal data USD 160, other corporate data USD 154, anonymized customer data USD 115, and the shadow AI cost and detection figures.
- Baker Donelson. (2025). Full-text mirror of "Cost of a Data Breach Report 2025," used to verify the exact per-record figures, the 2024 comparison values, the 113,620-record methodology cap, and the cumulative 6,485-breach, 34,652-interview research history since 2005.
- Verizon Business and CyberAcuView. (2026). "2026 Breach Impact Study." Approximately 70,000 US cyber insurance claims reviewed, about 38,000 with recorded paid losses, covering incidents from January 2019 through October 2025. Source for the median per-incident cost trend, percentile breakdown, and cost by company revenue band.
- HIPAA Journal. (2025). "Verizon Releases Inaugural Breach Impact Study." Independent secondary reporting confirming the 70,000-claim sample size, the 2019-to-2025 study window, and the healthcare-specific liability findings from the Verizon and CyberAcuView study.
Note: All figures verified as of September 2026 against IBM's Cost of a Data Breach Report 2025 and Verizon and CyberAcuView's 2026 Breach Impact Study. IBM's report is published annually each summer and Verizon's Breach Impact Study is a new annual companion to its Data Breach Investigations Report; figures here will be refreshed when the next editions are released.